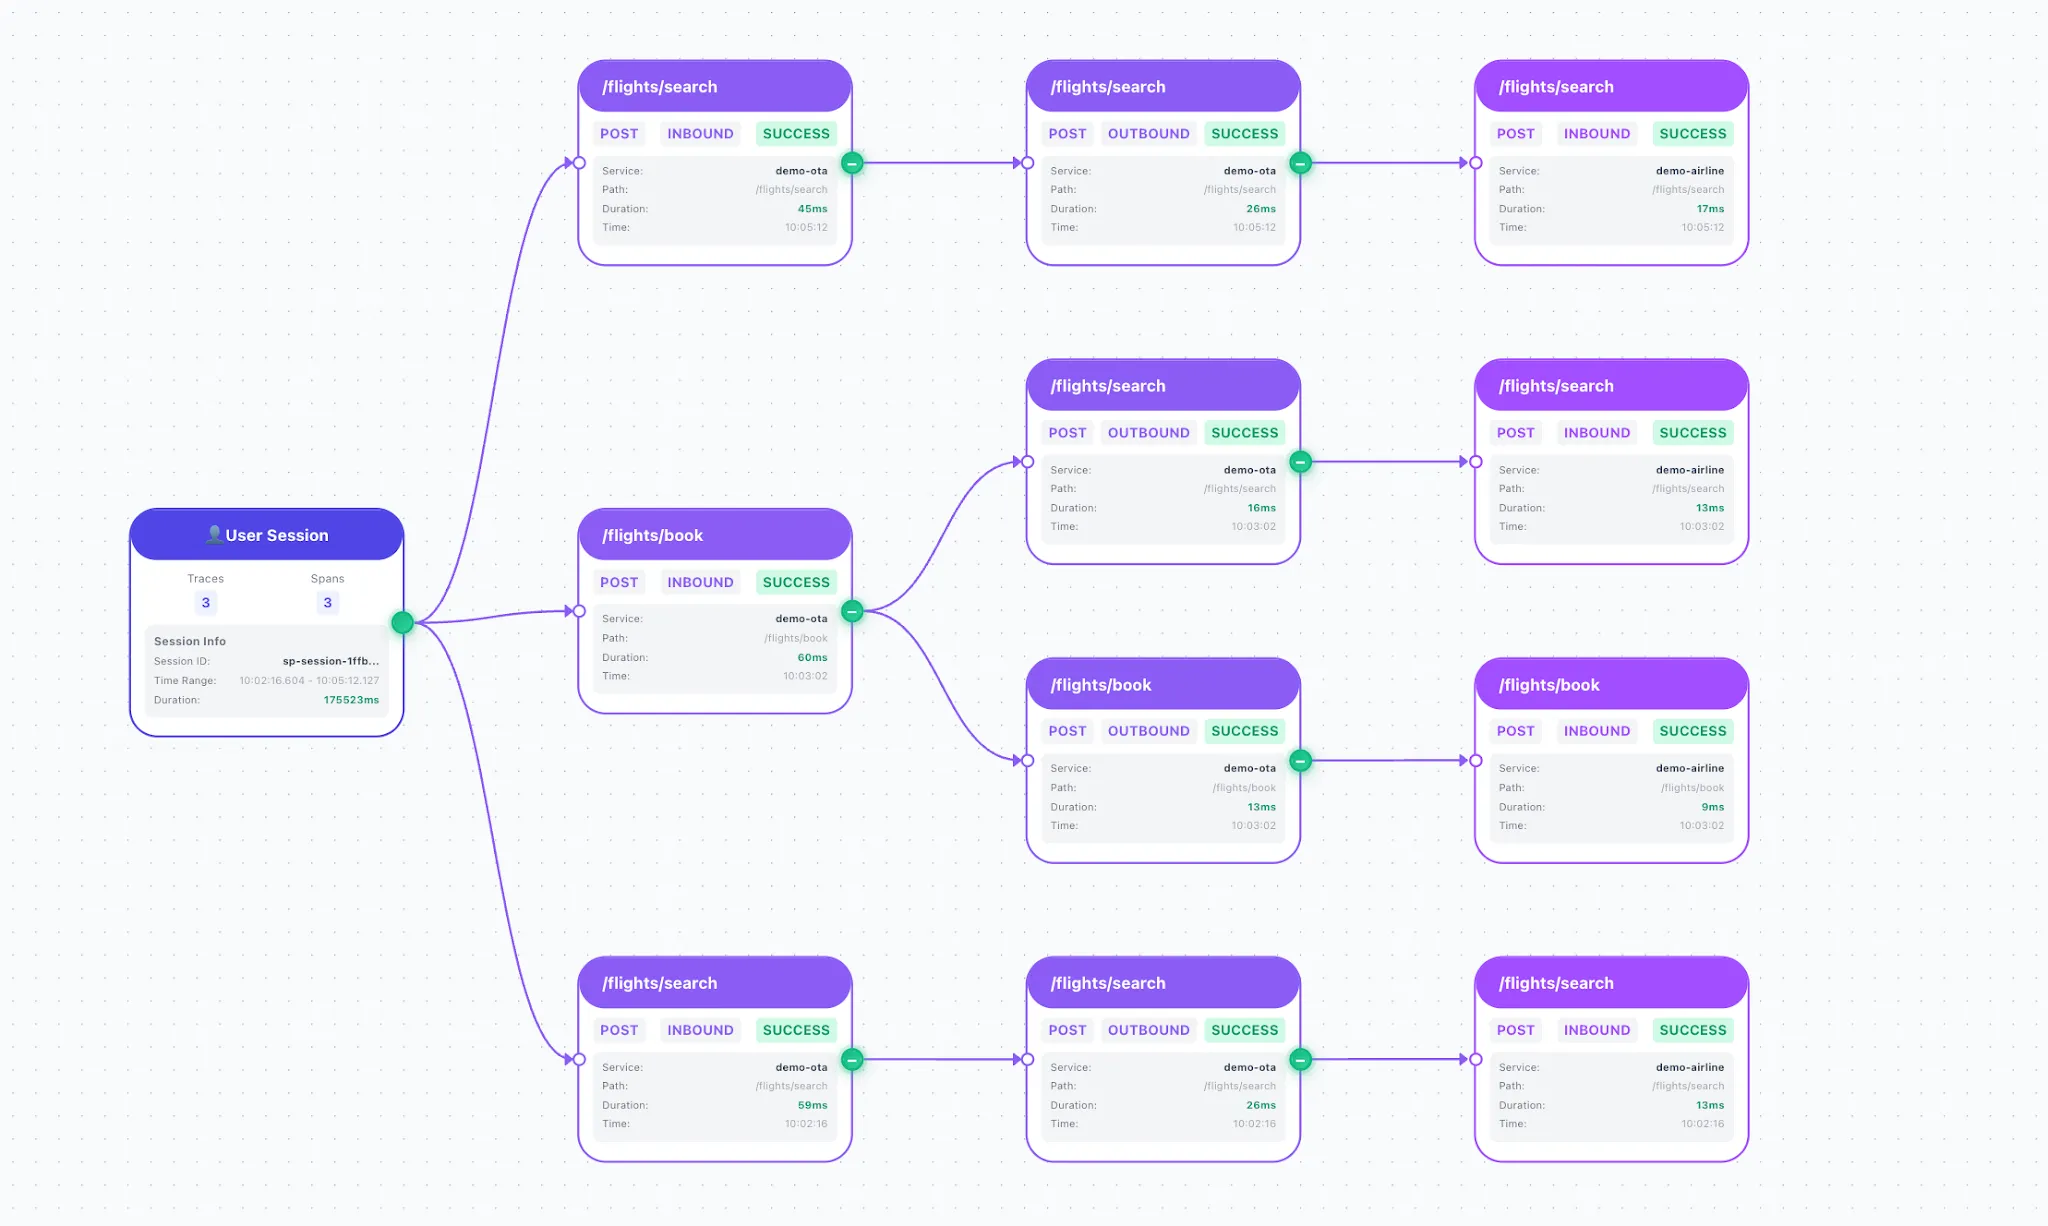
Log events as structured session graphs— the language of AI agents
Reduce observability costs by up to 90%
Preserve 100% of user sessions (no sampling!) including all API message bodies
Root-cause production issues instantly
Native OpenTelemetry support

Grafana Integration Available
Visualize your session graphs directly within your existing Grafana dashboards.
Text-Based Logging
Legacy tools treat your system data as unstructured text. This creates isolated snippets of errors (like Error 500) that take hours to root cause.
Fragmented Data
Isolated log lines with no connection to the original request or user session.
Hours of Investigation
Manually correlating errors across services to find root causes.
Context-Based Logging
Softprobe introduces Context-Based Logging. We capture the entire execution context as an AI-ready structured data object.
Full Causality
We link the Input (Request) directly to the Output (Response) and every database query or API call in between.
Instant Clarity
See exact inputs, database state, and which line broke.
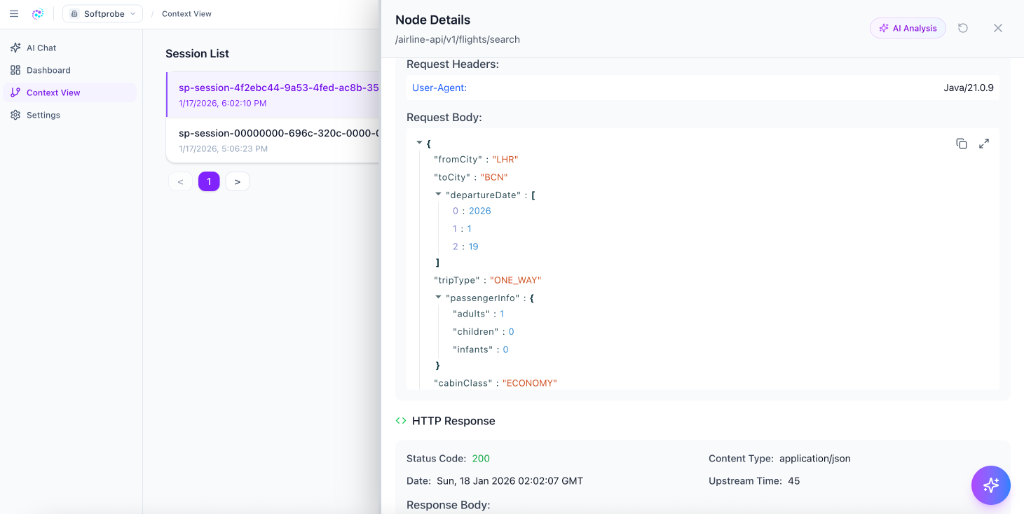
Powered by the Session Graph
Visualize context using our proprietary Session Graph technology.
AI-Ready
Structured format allows AI Agents to pinpoint root causes automatically.
Cost-Effective
Text logs are expensive to index. Softprobe organizes data as structured graphs, reducing costs.